Wednesday, April 8, 2009

Looking Ahead

Click chart to enlarge
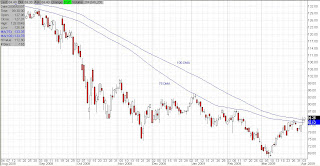
We've been talking to a lot of Wall Streeters about the near term future of the stock market, and telling them about the speculative activity brewing in the high end real estate market. Most of them are skeptical that we're out of the woods, saying that there are still a LOT of problems out there. Maybe we're being too optimistic, maybe not. Regardless, they all do agree that we've hit a bottom. They don't believe we're going lower, but are at the same time not willing to bet that we go much higher for a long time. The concensus of those we've talked to would result in a chart that looks much like the one posted above. Stage 1, if you have to give it a label. We're told that while the market should not plunge from here, it will not be a "V" bottom either. A long basing period that lasts a year or more is what many think is in store for us.
We're committed to doing very heavy buying anywhere in the lower part of the channel drawn on the chart, and selling near its top. There's little risk selling at Dow 9,000 given that the economy is unlikely to rebound without a long struggle. There's also little risk buying the indexes at or near Dow 7,000, or so we're told, as analyst expectations have already factored in armageddon. This guess is as good as anyone's, and we'd appreciate any commentary on why we should rethink this.

Saturday, April 4, 2009

SPY

Click chart to enlarge
The chart above shows the S&P500 index (SPY) as of the close Friday. It broke and closed above both its 75dma and its 100dma. It's truly at an inflection point because the break is not yet decisive. If the market sells off from here, this will just look like another rejection at the 75dma like all the rest, despite exceeding it by a bit. It's uncanny how precisely it turned around the last 4 times when it reached the 75dma.
We believe that the market will move higher from here, but it all depends on the next session or two. If we have another big up day, then the market will have changed sentiment in a big way. In that case, we could make a run for the 200dma at Dow 9400, S&P 1000. Of course if we did actually get to the 200dma, it would be a little lower by then. The 200dma is the dividing line between bull and bear market. If we did get that far, we would have a very tough time breaking it. We would probably be rejected at that line 3 or 4 times.
We continue to be convinced that the market has bottomed and that the economy is showing signs of life that will hit Main Street in 9 to 12 months. This does not rule out a drop back to Dow 6500-7000, but it would be a gift. Our prediction for the long term is that the market will go sideways between 7000 and 9000 as it consolidates these recent great losses and puts in a solid base from which to launch the next bull market. This consolidation could take anywhere from 1 to 3 years. We believe that the 10 - 20 year consolidations of the past are not applicable today. Everything happens in a very compressed time frame today, although the basic principles haven't changed. We'd be very suprised if the next great, sustained bull market begins any later than 3 years from now.

Thursday, April 2, 2009

The Stages

Click chart to enlarge
We bought some SSO when the market broke through the top of its downtrending moving average where indicated by the first purple arrow on the chart above. Somewhere there is a post or comment made at the time about this trade. We sold some DDM when the market broke the uptrending channel at the second purple arrow. There is a post or comment that mentions that, too. These were our only trades for the time period shown on the chart above.
The reason we mention this is because it seems there is some confusion on this blog about the purpose of the channels/averages and TA in general. We tried to sum it up on the previous thread in a comment to Anon, then realized that a picture is worth a thousand words, hence this new post. The bottom line is that since the market broke the channel and moving average, we're in no man's land right now. You must be cautious because the market does not have a clear direction as it did when it was in its downtrending channel or when it was in its uptrending channel. Until a new channel forms, the market is in limbo (stage 3).
Here is our comment to Anon on the previous thread...
Anon, there are four stages...
Stage 1- sideways after a downtrend - choppy, breaks the moving average many times in both directions
Stage 2- uptrend (price is above uptrending moving average)
Stage 3- sideways after an uptrend - choppy, breaks the moving average many times in both directions
Stage 4- downtrend (price is below a downtrending moving average)
These stages typically take months or years to play out, using the 200dma as the average. We've applied the concept to the current short term rally just to get a better idea of how to time it for ourselves. Right now, the market as a whole is no doubt in a Stage 4 downtrend. There's no disputing that. It is trending lower below a downtrending 200dma. If you zero in on just this little multi-week rally that we're having, then the market is in a little Stage 3. It is no longer in a Stage 2 uptrend. Nor is it in a Stage 4 downtrend... yet. Once it enters Stage 4, if it does, then you have to assume it's going to zero until it stops falling. It may just be resting right now, consolidating the recent huge advance of the past several weeks. We may start a new Stage 2 uptrend after this consolidation is over, or we may fall into a Stage 4 downtrend. Nobody knows. We sold some DDM when the channel broke because we had left the Stage 2 uptrend, making the market riskier going ahead. It isn't that we thought it would tank, it's just that once the channel was broken, the odds of it rallying further were much less than they were when the channel was intact.TA is not meant to give you foolproof buy and sell signals, although sometimes it does. What it really does is helps you put the odds in your favor over time.Right now, the market is less decisive than it was when it was in the channel. It could go either way. We buy the dips when the market is in the channel. Right now, we would not buy the dips because if one of these dips makes a new low, we may be starting a Stage 4. You see, the stages help you decide what mood to be in... bullish, cautious, bearish, etc.Right now, we're in a short term Stage 3, so our mood is neither bullish nor bearish, it's cautious.

Wednesday, April 1, 2009

Moving Average

Click chart to enlarge
This chart of the Dow which goes back to the start of the recent rally shows a change of character for the index. It is now trading below its moving average, which is starting to turn down itself. This line which served as the approximate support level during the rally is now resistance. The one big drop we saw last week, which decisively broke the trend channel and moving average changed market sentiment... at least for the time being. This is no longer a "buy the dips, rally mode" kind of market. It's now a nervous "which way next" kind of market. It's too early to call it a "sell the rallies" market, but another lower high (rejection at the moving average) would change that.