Thursday, May 29, 2008

Mechel - MTL

Click chart to enlarge
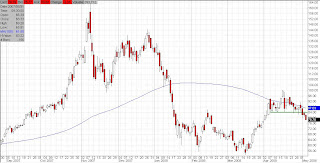
Our average price on MTL is 47.1 (Some of these shares were bought in April) We're looking to lighten up on MTL as it approaches the top of its channel. Dumping half at 57+ and the other half at 60 makes sense from a technical standpoint. Of course, that is, if we're given the opportunity to sell at those prices. After today's run, it's hard to believe it has any more upside short term other than a brief morning rally. Clearly MTL's long term uptrend is intact, and if we do sell, we'll immediately start watching for a re-entry point.
While MTL may soon be getting overbought, the Ag names are looking like they may have bottomed. It's way too early to make that call yet, so we'll just have to wait and see. We're hoping for lower prices (a capitulative bottom), but we may have to settle for the soft landing we just got. Odds favor short term profit-taking over a strong follow-through move, so if the near term strength gets irrationally exuberant, we'll be ringing the register on some of our Ag holdings just as a trade. Any stock that goes up 15-20% in two days can usually be had at a discount a day later. We're not looking to sell, but if CF is up another 12 tomorrow, we'll lock in some quick profits on 25% of our CF position and look for re-entry. It's an unlikely scenario, but if opportunity knocks, we'll be home.

Wednesday, May 28, 2008

Consolidation - DBA

Click chart to enlarge
DBA is still consolidating awesome first quarter gains. It has formed a descending triangle, and will break out one way or the other very soon. If it breaks down, we're expecting a capitulation (major buying opportunity) in the Ag names followed by a continuation of the uptrend for the rest of the year. This is the preferred outcome, as it would create some very low intraday prices. As long as DBA stays above its 200dma (blue line), it is in a long term bull trend. If it breaks to the upside instead, then the recent lows in the Ag names are likely to hold. This would be a less dramatic bottom, and would not provide for anything other than an "average" buying opportunity. We like the "people jumping out of buildings" type selloff, but those are few and far between.

Tuesday, May 27, 2008

Mosaic - MOS

Click chart to enlarge
Mosaic is at the bottom of its channel, above its uptrending 100dma. By all accounts, its uptrend is currently intact. Same for CF. Even more so for POT and AGU which are not even close to the bottoms of their channels. As a rule of thumb, stock charts don't make strong new highs and then go down forever. They make a series of lower highs before breaking down. If the Ag group were at the end of its growth cycle, then they would make a final stab at new highs and fall short of the mark before completely breaking down. If Mosaic's last run failed to produce a new 52 wk high, we would be nervous about its current position. Considering its last run was exceptionally strong, and other names in the group are even stronger, we feel that MOS has more life in it. That's purely from a technical standpoint. We're starting to put the other 50% of our cash into these names right now. We're not calling a bottom, but we feel comfortable adding to our positions here.
From a fundamental standpoint, we don't feel that the run in the Ag names is ready to end anytime soon. We also feel that with their low p/e's, they are not a bubble waiting to burst.
Starting to buy these names here and adding if they continue to drop makes sense in any diversified portfolio. This may not be the bottom, but we are sufficiently off the highs to start looking for bargains. We're partial to POT. We are strongly attracted to the highest relative strength stocks in a sector. Call it "best of breed" if you want. We'd rather buy POT when MOS is at the bottom of its channel than buy MOS itself. Either way, a small position here makes sense both technically and fundamentally.
Reminder... a little SMN goes a long way to hedge long Ag positions. If these names have one capitulative day, SMN could reach the low 40's. From a percentage standpoint, it doesn't take much SMN to insure a lot of MOS, MON, POT, CF, and AGU.
As for the indexes, it's anyone's guess where they go next. All we are certain of is that they are too high for the reality of the current U.S. economy. At some point, reality will win the tug-of-war.

Friday, May 23, 2008

Relative Strength - POT

Click chart to enlarge
Above is a chart of POT. In case you're wondering, its current price is 193.8701, lol.
If you were buying 200 billion shares, that .0001 might matter. At any rate, this post is primarily in response to someone's question about POT going sideways through the bottom of its channel. POT got so far ahead of itself, that it isn't in danger of falling to the bottom of its channel. The stocks that sell off the least when the market goes down are the ones that go up the most when the market eventually turns higher. It's called relative strength, and is the single most important quality a stock can have. If there were only one bit of publicly available information you could have upon which to base a stock purchase, relative strength would be the one to choose. Relative strength immediately tells you whether or not smart money is accumulating or distributing.
POT fits the criteria for a model stock. Barring any major problem with commodities, this is a stock you want to be buying on dips, particulary if you can hold onto it for 6 months or more.
Considering the state of the market, POT is holding up extremely well. Rather than look at how much it's fallen from its highs, look at its price from two months ago. It traded at 136 in March. Here we are, two months later, at 193. It would be nice to get it back at the bottom of the channel at 170, but we'll be adding little by little ahead of that milestone.

Wednesday, May 21, 2008

Broken trend - The Dow

Click chart to enlarge
If the Dow had a trendline, it broke it today. It still hasn't broken its 50dma (not shown) to the downside yet, although it closed right at it. There's no question when looking at this chart that the 200dma is a very real psychological barrier. Even those that put zero faith in technical analysis would be hard pressed to explain why that blue line has controlled investor sentiment for the past several weeks. Technicians would tell you that because we never closed above it (by more than a few points), we are still in a bear market.
A retest of the January lows should come as no suprise if it happens. Bargain hunters will likely create a little rally in here soon. We tend to think any relief rally will be sold. They can lie about the CPI, they can lie about the containment of the credit crisis, and they can lie about consumer confidence, but they cannot look us straight in the eye and tell us that oil prices will not have a substantial adverse affect on corporate profits. The higher oil goes, the more people are realizing that it is a serious situation. At least as serious as the credit crisis. Of course Americans can learn to conserve, and learn to budget for it. But not so quickly. Americans by nature are decadent creatures who are governed only by hindsight. Their retroactive nature is what makes it so easy to predict that their current budgets are ill-prepared for this new crisis. Despite current high oil prices, this winter's heating bill will come as a suprise to many. We can't figure that out, but that's how things work in America. After their first 275 gallon fill-up at $5 a gallon, Americans will put the brakes on spending. Q1 2009 suddenly doesn't look so promising now, does it? Second half recovery, lol!
Some fun Snot predictions if oil stays above $130:
1.) The price of firewood nearly doubles from last year's prices
2.) One used SUV is for sale on the side of the road per mile
3.) The travel industry grinds to a halt - Disney's profits suffer
4.) At least one major airline goes bankrupt
5.) A resurgance of interest in alternative energy stocks (solar, wind)
6.) Sales of bikes, scooters and roller blades rise as city people refuse to pay increased cab fares
7.) Sales of wood burning and pellet stoves rise

Monday, May 19, 2008

The Dow - 200dma

Click chart to enlarge
The 200dma is still holding the Dow back. Same is true for the S&P. We're only concerned with getting good prices on the Ag names right now, and it looks like we may be setting up for a good entry point soon. DBA's chart is ominous. It's a descending triangle. If DBA breaks support at around 35.5 and heads for its 200dma at 33.5, we could get a capitulative day for the Ag names which would provide great buying opportunities for those willing to hold for 6 months.
Steel (MTL and SID), are also on our "commodity capitulation" wishlist, but they don't seem to want to correct. We're willing to pay up a little for MTL and POT because they give up ground reluctantly, suggesting that they'll be making new highs later in the year next time sector rotation favors them. Others like MOS and CF are already trading at the 1/4 marks of their channels, so they'll likely reach the bottom with even a small correction. It's just a matter of time. We're willing to jump in with both feet when the Ag sector corrects, despite where the broader market is. It is possible for a sector to "bottom out" long before the broader market hits bottom. We use trend channels because they let you get in and out of stocks without being influenced by what the broader market is doing. It is completely possible for the Ag names to hit bottom over the next few days and never see those lows again, even if the Dow drops 1,000 points over the next few months.

Friday, May 16, 2008

Mechel - MTL

Click chart to enlarge
We haven't posted in a while because there hasn't been much going on. Just holding POT, MOS, CF, AGU, MTL and a little SMN. Cramer, are we diversified?
If MTL spikes higher on Monday, we'll sell some of it (see chart above)
Of greater interest right now are the indexes themselves. Both the Dow and the S&P are just below their 200dma's. We think they will very likely break through them strongly very soon. Why? Mostly because the Nasdaq has already broken its 200dma, and the market's current momentum is to the upside. While we think the market will head higher over the short term, we are only 50% invested because the American economy is a complete disaster.
The market can shrug it off... until it can't. This is the same feeling we had last Fall, when the market was surging higher despite rampant foreclosures and ever growing concerns about the spread of the subprime crisis. The market did a great job of ignoring all of the economy's underlying problems until finally reality hit hard.
Same thing now, only it's oil and food prices that are weighing on the economy. Oil hit new highs today. The catalyst for the next drop in the market will likely be a combination of two things. First, an overbought market. It's our opinion that anything above the 200dma is a bubble, given the weakened state of consumer confidence and an unprecedented inflation rate. Second, earnings shortfalls. Expectations were lowered for the first half of 2008, but still anticipate a second half rebound. If that second half rebound doesn't happen, then many expectations will have to be revised lower.
We're looking to get the other 50% of our capital into the market, but are looking for "bottom of channel" prices. Patience is a virtue.

Wednesday, May 7, 2008

The Dow - 200dma

Click chart to enlarge
Bull market or bear? From a technical standpoint, it's being decided right here at the 200dma. This could be a long drawn out battle. We've kept all of the Ag we bought on the last dip, and are now 50% invested. Seems fitting for an indecision/inflection point of this significance.

Monday, May 5, 2008

Sunpower (SPWR)

Click chart to enlarge
The charts of SPWR and STP continue to look anemic. These aren't stocks we own, but we've been watching them as a sign of how much speculation has returned to the market. The solar stocks seem to attract all of the gamblers, so watching these stocks gives you insight into how frothy (overvalued) the market's bubble can get. It's our theory that any Dow action above the 200dma is a bubble as long as gas prices are at $4 a gallon. You can have a healthy stock market OR high gas prices, but not both. The bubble hasn't officially started yet, as the Dow has never closed above its 200dma.
At this point, gas prices alone are enough to keep the economy lagging for the next several quarters. Here's the quick math:
A household earns $75,000 a year. $15,000 goes to Federal income taxes, $5,000 goes to state income taxes, $8,000 goes to local real estate taxes, $24,000 goes towards the mortgage, $2,000 goes towards car insurance, $1,000 goes towards homeowner's insurance, $10,000 goes towards food, and $5,000 goes towards home heating oil, electricity, phone, and tv. That leaves the average American household with $5,000 of spending money each year. That's roughly $100 a week. 100% of that is going to Exxon Mobil now, so our model family is not taking a vacation this year, not dining out, not buying new clothes, etc. If our model family has to pay for health insurance, their yearly spending figure becomes a cool negative $7,000. That all adds up to a lagging economy, which in turn results in a lagging stock market. That's our take on it, anyway.

Thursday, May 1, 2008

The Dow - 200dma

Click chart to enlarge
The Dow is within 25 points of its 200 day moving average. Technically, we're still in a bear market until we move above it. If the market does start a new bull run from here, then it's going to just be another bubble because the economy isn't ready for it. Not with oil, food and insurance prices rising at 50% a year. No doubt Bush's stimulus package (you know, the one where we get $600 this year and a tax bill for $15,000 next year) will artificially pump the numbers over the short term. But what happens as this bubble expands and then two quarters from now corporate profits show that Americans weren't spending their money on anything but oil? Could be ugly, kind of like last Fall, where the market rallied strongly in the face of severe underlying economic problems.
While it's fun to guess at, we don't attempt to outright "time" the market. In that spirit, despite the beginnings of a bubble forming in the indexes, we added to POT, AGU and MTL today. CF and MOS also offered a good entry point, but we're already overweight in them relative to their respective locations in their channels, so we held off on adding to those names. POT at the midpoint of its arithmetic channel today... too good to pass up.
Tech... quickly getting overbought. AAPL can keep right on going because its investors are the most loyal cult-like followers around (second only to AMZN's). But at 25% growth, we'd only pay a p/e of 25. Maybe 30. After all, AAPL's market cap is such that it isn't a company that's likely to double in size anytime soon. Based on a p/e of 25/30 and an eps of $5.20, we'd pay about $130 to $150 for AAPL. By the end of 2009, it will be worth about $190 (30p/e x $6.30eps). Considering it's trading at $180 now, we don't understand why people would buy it here. That said, AAPL is not the kind of stock you want to short while it has upside momentum going for it.