Thursday, December 31, 2009

LED Stocks


There was a time when our portfolio consisted of nothing other than fertilizer stocks. The pie chart above shows how little we diversify when the going is good. "Cramer, we own MOS, POT, CF and AGU. Are we diversified?"
In July 2008, the fertilizer stocks broke down, and we knew the market was done for. We got out and sat on the sidelines for a few months, eventually scaling into a few Ultralong index positions. We got into these positions a bit too early (never expected the market to drop 60%). Nevertheless, they became profitable, so we continued to hold. We let them go yesterday, putting us back to an all cash position.
Since we sold the fertilizer names back in mid 08, other than index ETF's, we haven't owned another stock since... until now.
We said we would wait for new innovation before investing again. We've found something that's piqued our interest, although granted it's not the next "internet" or "biotech" revolution.
This is a smaller innovation, but the size of its market is phenomenal. It is LED lighting.
Currently, the overwhelming majority of people still buy incandescent bulbs. They've been around for 126 years, so it's a tough habit to break. But this is about to change.
The 2008 energy bill has a section that phases out incandescent lightbulbs for residential applications by 2014. The phase-out begins in 2012. Everyone will be forced to buy CFL's or LED's. CFL's are in the running to replace incandescents, but they are less efficient than LED's, and most of them are not dimmable.
LED lighting has a bright future. But how to capitalize on this information? To do this, you'll need four tools. The first, and most important tool, is patience. This is not a short term trade. LED stocks should be bought and held for about 2 years. The second tool is a basic understanding of fundamental analysis. Right now, these stocks are all overpriced. More on that later. The third tool you'll need are the charts. Being that we'll be investing heavily in LED stocks, we'll be posting charts of the major players in the LED sector on this blog frequently.
The fourth tool you'll need is a basic understanding of the companies that make up this space.
We invite your commentary on which companies are playing "behind the scenes" roles in this technology.
Our understanding of it is that CREE is the largest pureplay in the space. While Philips (PHG) produces LED lighting, as a rule we avoid companies that are not pureplays. The basic concept behind this is that if 4% of a company's business doubles, you're not going to get much out of it. This precludes us from buying AMAT, which is involved in LED technology as well. They've got their hands in so many different businesses that even if they become the leader in LED, their architectural glass division (for example) will mitigate their success. Who needs that?
While CREE is the largest and most visible of the names, it isn't our favorite. We've had better luck in the past betting on the second or third companies because they often have more room to grow. Back when fiberoptics were heating up, we loaded up on SDLI, buying only a small stake in the 800lb gorilla, JDSU. Those of you who've been around long enough to know these names know that JDSU eventually bought SDLI.
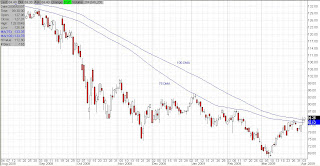
You can also do well buying the guys down the chain... the material providers and such. If you look into the LED space, you'll find that Aixtron (AIXG) and Veeco (VECO) are two such names. Our favorite stock in the LED space is AIXG (see its chart above).
Ok, now back to fundamentals:
All of these companies are expected to have excellent earnings growth over the next 5 years. Hence the name, "growth stocks". Naturally, growth stocks come with higher P/E ratios because P/E's are a direct function of growth. As a rule of thumb, a fair value for a growth stock can be calculated by multiplying its annual growth rate by 1.2, then by multiplying that number by its EPS. The number 1.2 is known as a PEG ratio. Warren Buffett's stocks typically have PEG's of approx 1.1 to 1.2. Although your stocks as a growth investor will have higher P/E's than his, you should be content if you're paying the same PEG as he is.
So let's do the math for CREE:
Let's say it will grow by 25% a year for the next 5 years.
25 multiplied by 1.2 equals 30
CREE's current EPS is .79
CREE's EPS next quarter should be .96
30 multiplied by .79 is $23.70
30 multiplied by .96 is $28.80
A fair price for CREE right now would be somewhere around $27
Now let's do the math for AIXG:
Let's say it will grow by 25% a year for the next 5 years.
25 multiplied by 1.2 equals 30
AIXG's current EPS is .32
AIXG's EPS next quarter should be .42
30 multiplied by .32 is $9.60
30 multiplied by .42 is $12.60
A fair price for AIXG right now would be somewhere around $11
------------------
Seeing as how CREE is currently trading at $56 and AIXG is currently trading at $33, it's tough to pull the trigger. Certainly if the market corrects, these "momo" stocks will get hit hard and fast, giving us a great entry point. Then they'll bounce back as quickly as they fell, making new highs long before the market itself.
So do we wait to buy CREE at $27 and AIXG at $11? No. Unless there's another economic meltdown and market panic, you won't be that lucky. Even if these stocks correct, they won't go that low. This is for two reasons. First, corrections take time. By the time the market corrects, we'll be further ahead in their fiscal year, giving them higher EPS's. The above figures would have to be recalculated. Second, the above figures are conservative. What if these companies grow by 30% a year, thereby deserving of a P/E of 36?
You can't be a value investor and a growth investor at the same time. You have to accept that you're going to pay up for growth and popularity if you want to ride the train. But that doesn't mean you have to buy at the very top. Wait for a dip and buy some. Then wait for a broad market correction and buy some more. Scale into your position as the market drops, and as the stock gets reasonably close to a price that you're comfortable paying for it. Then have patience. If you're going to hold it for a couple of years, then you have to believe in it. Your belief in it, according to Peter Lynch, can be a very simple thing. What intrigues us about LED lighting is the sheer number of lightbulbs that need to be replaced over the next 4 years. Basically every light bulb in the world will be replaced. Think about that. Then hold your LED stocks through thick and thin until they become a household name.
We waited to see if LED would catch on before deciding to start scaling into it. The reason is that the growth market is largely a popularity contest. Two companies with identical books can be treated very differently in the same market. Whichever one inspires awe in people will win the race. (Then go to zero, of course.)
We welcome any commentary about LED stocks or our investing methods, as always. If you know of any other new innovation that looks promising, please let us know about it as well.
Let's work together to triple our portfolio values!

Wednesday, December 30, 2009

S&P500

Click chart to enlarge
We may be seeing the first signs of slowing momentum for the indexes today. There has been no break of any trendline or average, but this is not how a healthy Stage 2 chart rallies following five weeks of consolidation. The horizontal line drawn at the upper left on the chart of the S&P500 index above acted as resistance for over a month. Once broken, the chart should have rallied strongly to new highs without any hesitation. This would be textbook of how a chart breaks out into a higher trading range. Today's backpeddling just days after a feeble breakout does not bode well for the broader market. If this market doesn't pick up steam quickly and follow through on the rally it started, we may just be right that it's in its early stages of forming a top. If this is a top forming, the market will drop, then launch a rally that fails to make new highs. This would be the next sign. Finally, after failing to make new highs, it would break through the bottom of the trend channel and moving average. This is the scenario we're hoping for, but it's way too early to call it yet.

Tuesday, December 29, 2009

We're Out!

Click chart to enlarge

We just sold the remainder of our Ultralong index positions, which we've been holding for just over a year now. The market is still in a Stage 2 uptrend, trading above an uptrending moving average, so there is no clear sell signal. Still, we see this end-of-year window dressing rally as an opportunity to exit the market and begin a new year. One of our New Year's resolutions is to use the S&P500 index (above) as our default index instead of using the Dow.
We feel that the market cannot go up forever at this pace (67% in under a year), especially in the face of rising oil prices. We just feel it's time to not get greedy and instead start to focus on our next adventure... LED lighting.


Wednesday, December 16, 2009

Indexes

Click chart to enlarge
The chart above is of OEX (the S&P 100 index). All of the indexes have the same formation, so this could just as well be the SP500 or the Dow, it wouldn't matter which. There is a clear ascending triangle forming on the indexes. Resistance has been well defined over the past 6 weeks or so, and the charts remain in a Stage 2 uptrend, trading above uptrending moving averages. It is our strong feeling that it will not be long before the indexes break out to the upside. We also believe that that final surge to the upside (the blowoff) will mark a top, for the time being anyway. But one thing at a time... let's wait and see if there's a blowoff rally first. If so, we'll be selling the rest of our index position and getting back to 100% cash.

Monday, December 14, 2009

AAPL

Click chart to enlarge
We recently voiced our opinion that AAPL was getting ahead of itself on a valuation basis. We now see deterioration in the strength of its technicals, too. It broke its trendchannel and 50dma. If this chart appeared at a time when the market was beginning to melt down, this would be a screaming sell. But considering the market remains bouyant and other techs (particularly GOOG) appear healthy, this is not a 5 alarm fire. Nonetheless, now is not a good time to back up the truck and load up on AAPL shares. This is one chart that will see $200 again sometime in 2010, so there's no rush to buy.
In our ideal world, the market itself would "blow off"... rally another few hundred points (maybe even to 11,000), then top out in a big way, possibly retracing to 8,500 or so before stabilizing. If this scenario plays out, then in hindsight AAPL would have been exemplifying investor's current true feeling about the market. And that is that we're at a point where stocks are getting overpriced. We've come too far too fast. But whether or not our feeling is the concensus remains to be seen.

Gold Corrects

Click chart to enlarge
It was exactly 2 weeks ago today, with GLD trading at $109 that we said... "We're not saying it can't go higher, but that if it does, it will inevitably return to its current price sometime in the next few months. In other words, it isn't about to get away from any potential buyers at this point. Don't chase it."
The concept behind that post was that stocks only move so far away from their averages before they return to them. There's no harm in selling when a stock moves far above its average. Or at least lightening up as it advances into the nosebleed section. If you have the patience, you'll be able to buy it back again at the same price, so there's no risk. If you're lucky, it may just drop the day after you sell, setting you up for a nice trade. Beware of tax consequences.
As for the future of Gold, it hasn't broken any trendlines nor averages. It's still in an uptrend, trading above an uptrending moving average, so it is not a short candidate. If it moves lower from here, support is in the mid 90's. But it has already corrected approx 10% from its highs, so the worst may be over for now.

Wednesday, December 2, 2009

AAPL

Click chart to enlarge
We think AAPL has gotten way overextended. Maybe it breaks down from here, with a significant and decisive break of both its moving average and trendline. Or maybe it manages to keep itself within the channel, wedging itself into the little triangle formed by the ascending trendline and the horizontal support created by its October and November highs. From there, of course it could break strongly to the upside. But there's no way of making either of those calls right now. Our warning on AAPL shares are more rooted in the company's size than anything else. AAPL is simply too large to keep growing at its current pace, and it has once again nearly maxed out how far it can comfortably push the upper limit of its valuation range.
Let's suppose you could accept that AAPL will grow by 20% annually for the next five years. We find this hard to believe, but let's give them the benefit of the doubt. In that case, paying a P/E of 25 for the stock would be reasonable. Not a bargain by any stretch, but not outrageously expensive either. It would just be a fair P/E for the stock. Let's give AAPL the benefit of the doubt and calculate its current EPS using what they project to make for Dec 09. That would give AAPL an EPS of approx $6 per share. With a pricetag of $196, that gives AAPL a P/E of approx 33. Looking out about 12 months from today, AAPL is expected to have an EPS of $8 per share. If it stayed at today's price of $196, its P/E a year from now would be 25. So there you have it, a stock that should go sideways for the next 12 months, if indeed it wanted to return to a level where its price matched its value.
Considering the stock "should" be at its current price a year from now, there's little risk in buying or shorting it at these levels. It may go higher or lower, or maybe just sideways. But either way, at some point about a year from now, it'll be back at $200 again. We posted similar comments about AAPL's valuation last time it reached the $200 mark. So how do you profit from this? What we like to do is plant this seed in our head, and then watch the chart. If AAPL continues moving higher, our interest in shorting it increases. Perhaps in a month or two, it'll be trading on 2011's EPS. That would make shorting it a whole lot easier. If we thought it was high at $200, then it'll be a screaming short at $250... with a P/E of 42.
We don't actually short individual stocks, especially ones that are trading above an uptrending moving average. But it's still worth keeping tabs on where the four horsemen of tech are trading. They give you valuable insight into how rich the market is becoming. AAPL strengthens our thinking that the market itself is in its early stages of an overbought condition. Each step higher from here, the market is playing an increasingly dangerous game of musical chairs. When the music stops, there won't be any buyers left to fill the sell orders of those who want to take a seat on the sidelines.

Wednesday, November 25, 2009

Gold's Top

Click chart to enlarge
Stock charts typically get a certain amount above their moving average before falling back to reality. For gold, an overbought condition exists when the chart is 40% to 50% above its moving average. It doesn't matter what average you use. The percentages will change, but can still be used as a basis for comparison against each other.
The chart above shows that GLD (gold) is quickly reaching an overbought condition. How far could it go? Every 9 points represents another 10% rise above the moving average shown on the chart above. Therefore, a jump of 9 more points to a price of 125 would put GLD at 40% above its average. A jump of 18 points to a price of 134 would put GLD at 50% above its average. We're not saying that it won't go there. Of course, we don't know. But we do know that if it does reach those heights, particularly if it happens quickly, the chart is setting itself up for a dramatic return to the average.
The last two times GLD corrected, it fell roughly 25% to 30%. A repeat of this kind of correction would put GLD somewhere between $80 to $100 per share. There are few people out there at this point that don't already know that gold is the new hot investment. In fact, infomercials are popping up which are selling gold as the new investment vehicle of choice. The guy at the corner deli just bought some gold for the long term. If that doesn't signal a top in the making, we don't know what does.
In an ideal world, gold would quickly "blow off" to an incredible height (like $134) . From there, the downside risk would be too great to ignore, and people would start heading for the exits, leaving the guy at the corner deli holding the bag. This will surely be a fun chart to keep tabs on.

Saturday, November 14, 2009

Gold

Click chart to enlarge
The chart above shows the past 4 years of GLD, which tracks the price of Gold. We would never short a stock trading above an uptrending moving average, but we would lighten up on GLD at this point, and continue to lighten up on it if it advances from this point. We're not saying it can't go higher, but that if it does, it will inevitably return to its current price sometime in the next few months. In other words, it isn't about to get away from any potential buyers at this point. Don't chase it. Although very bullish, this chart looks ripe for a 7%-8% correction (at least to the low 100's).

Wednesday, November 11, 2009

The Dow

Click chart to enlarge
Is there anyone still reading this blog? We lost interest in the market for a while, but a recent glance at our account piqued our interest again. We're actually in the black since we started the blog in mid July. Barely in the black, but heck, flat is the new up.
Every time the market nears the top of the channel, we get tempted to drop DDM and SSO, but it never spikes high enough to tempt us that much. If we had a quick spike to the area of the red line, we'd sell it all and just wait. We still think that despite all of this recent strength, the market is just finding the top of a new sideways channel in which it will live for the next two years or so.
Before we have any truly sustained (multiyear) bull market, we need new innovation, which doesn't exist right now. When "the next big thing" comes along, this blog will be all over it. Finding the next leaders is what we do best. Well, that, and pointing out when they die.
But for now, the best we can do is stay long with a third of our stock portfolio and try to play the channel with some portion of those long holdings, all the while avoiding overexposure. At some point, the market will hit the top of its new sideways channel and then feel around for a bottom. Maybe sideways from 8,000 to 10,500 for two years? How does that sound? Your guess is as good as ours. We'd like to hear what others think the near term future holds.
More important than guessing the market's next direction is now trying to find that "next big thing." You won't find it any earlier than anyone else. You just have to understand it sooner.
We're most interested in any help we can get in spotting the next major phenomenon. Let's all work together and make the next bull work for us!

Tuesday, June 30, 2009

Bernie gets 150 years

What a light sentence, just a year for every 27 million stolen... from charities no less.
Bernie should have gotten a year for each $20,000 stolen, much like "blue collar" criminals would have gotten. That would put Bernie behind bars for the next 200,000 years. But as a "white collar" criminal, Bernie gets a slap on the wrist like his other Wall Street peers.
Of course he'll die in jail, so it doesn't really matter what his sentence is from that standpoint, but for those of us doing the math, white collar crime is looking like a good way to make a living.
Perhaps the criminal system will redeem itself somewhat and lock up everyone who was in on the scheme, including his wife and his sons.
Nonetheless, Bernie's sentence restores some of the faith that we all lost in Wall Street over the past few years. Maybe just 1% of it, but it's a start.

Monday, June 15, 2009

Selling DDM and SSO

Click chart to enlarge
This may be a bold move, but Tuesday, June 15th, we're going to sell just about everything. If you look at the chart that we posted on April 8th, we extended the lines out in such a way that the Dow would reach the 200dma sometime in June at a price of 8400 to 8700.
That's pretty much was has happened. But the eerieness of the predictive nature of that line drawing is not why we're selling.
We're selling because we're in a bear market, trending lower below a downtrending moving average and we just rallied back to the resistance line. We're by no means calling for the kind of plunge that we drew on that chart posted on April 8th. This is not meant to be an apocalyptic post calling for the end of the financial markets. That ship has sailed. We're not saying that the market is about to crash, but that we feel we've gotten to a point where the risk outweighs the reward. People have become complacent, and the fundamentals do not support complacency.
Sure the market could continue its run to 9500. But if it does, it's coming right back. So where's the gain? It's extended to a point now that a further rally would be excessive. Not impossible, just excessive.
Economists are calling for growth by the end of the year. We feel they are being too optimistic and setting us all up for disappointment. Gas prices are on the rise again, talk of higher interest rates has curbed spending, and the job market has yet to improve in a significant way. So where have we gotten since hitting bottom in February? Did we deserve the last 2,000 points? We happen to think we did, as the selloff was overdone. We just don't think we deserve another 1,000 points. Or even another 500 for that matter.
People are treating this market as if we're setting up for the next bull. We're nowhere near the next bull market. A bull market is not just an uptick in the stock charts. It's a whole new era in innovation, creativity, technology. When Al Gore invented the internet we had a bull market on our hands. This is NOT a bull market.
We're not suggesting anyone should follow us in selling everything. We just decided that it's time we start making bolder moves with our portfolios, and letting our gut have greater influence.
We continue to believe in our earlier forecast that the market will remain rangebound between 7000 and 9000 for the remainder of the year, and only slightly improved (7500 to 9500) throughout 2010.
So here we find ourselves at Dow 8600 weighing 400 points of upside against 1600 points of downside with the tune "you gotta know when to hold 'em, know when fold 'em, know when to walk away and know when to run" going through our heads. Thanks Kenny.
Sorry for not being more active blog authors. We do read the comments that everyone writes, but time constraints keep us from posting more often. There's also no need, as one post pointed out, to keep reminding everyone on a daily basis that the market is rangebound.
After selling tomorrow, we will likely post more often, as we'll be looking to get back in soon enough. Good luck!

Thursday, June 4, 2009

200 DMA

Click chart to enlarge
We just updated our performance for the first time in a while, and after one year on this blog, we are down 6.8%. The Dow is down 30.1% over the same time period. Not a great year for us, but we did manage to not lose big, and that's what 2008 was all about.
As for the market, we were hoping for Dow 9,000 as an opportunity to sell some shares, but we're hitting a major hurdle right now. We've run into the all-important 200dma. The 200dma is universally used to distinguish between bull and bear markets. It's the dividing line, so to speak. Technically, this would not turn into a bull market until we're trading above the 200dma and the 200dma is moving up as well. This takes time. For now, though, a significant break of the line would be a major milestone for technicians, and give hope to all that the market has finished its slide.
If we were more heavily invested at this point, we'd be lightening up on some of those shares right in here. However, considering we're only about 1/3rd invested, we're just going to wait and see. If the market does get rejected at the line and resume its fall, we'll just be adding to our position all the way down. It's hard to believe that we could possibly launch any kind of sustained bull market given there's no new industry or invention driving it. All we've really done over the past couple months is make up for a severe over-correction in the market. Hardly a bull. If we had to guess, we would vote that the market drops from this point. However, Government Sachs may have a different idea for the near term future of your 401k that we're not privvy to.

Wednesday, April 8, 2009

Looking Ahead

Click chart to enlarge
We've been talking to a lot of Wall Streeters about the near term future of the stock market, and telling them about the speculative activity brewing in the high end real estate market. Most of them are skeptical that we're out of the woods, saying that there are still a LOT of problems out there. Maybe we're being too optimistic, maybe not. Regardless, they all do agree that we've hit a bottom. They don't believe we're going lower, but are at the same time not willing to bet that we go much higher for a long time. The concensus of those we've talked to would result in a chart that looks much like the one posted above. Stage 1, if you have to give it a label. We're told that while the market should not plunge from here, it will not be a "V" bottom either. A long basing period that lasts a year or more is what many think is in store for us.
We're committed to doing very heavy buying anywhere in the lower part of the channel drawn on the chart, and selling near its top. There's little risk selling at Dow 9,000 given that the economy is unlikely to rebound without a long struggle. There's also little risk buying the indexes at or near Dow 7,000, or so we're told, as analyst expectations have already factored in armageddon. This guess is as good as anyone's, and we'd appreciate any commentary on why we should rethink this.

Saturday, April 4, 2009

SPY

Click chart to enlarge
The chart above shows the S&P500 index (SPY) as of the close Friday. It broke and closed above both its 75dma and its 100dma. It's truly at an inflection point because the break is not yet decisive. If the market sells off from here, this will just look like another rejection at the 75dma like all the rest, despite exceeding it by a bit. It's uncanny how precisely it turned around the last 4 times when it reached the 75dma.
We believe that the market will move higher from here, but it all depends on the next session or two. If we have another big up day, then the market will have changed sentiment in a big way. In that case, we could make a run for the 200dma at Dow 9400, S&P 1000. Of course if we did actually get to the 200dma, it would be a little lower by then. The 200dma is the dividing line between bull and bear market. If we did get that far, we would have a very tough time breaking it. We would probably be rejected at that line 3 or 4 times.
We continue to be convinced that the market has bottomed and that the economy is showing signs of life that will hit Main Street in 9 to 12 months. This does not rule out a drop back to Dow 6500-7000, but it would be a gift. Our prediction for the long term is that the market will go sideways between 7000 and 9000 as it consolidates these recent great losses and puts in a solid base from which to launch the next bull market. This consolidation could take anywhere from 1 to 3 years. We believe that the 10 - 20 year consolidations of the past are not applicable today. Everything happens in a very compressed time frame today, although the basic principles haven't changed. We'd be very suprised if the next great, sustained bull market begins any later than 3 years from now.

Thursday, April 2, 2009

The Stages

Click chart to enlarge
We bought some SSO when the market broke through the top of its downtrending moving average where indicated by the first purple arrow on the chart above. Somewhere there is a post or comment made at the time about this trade. We sold some DDM when the market broke the uptrending channel at the second purple arrow. There is a post or comment that mentions that, too. These were our only trades for the time period shown on the chart above.
The reason we mention this is because it seems there is some confusion on this blog about the purpose of the channels/averages and TA in general. We tried to sum it up on the previous thread in a comment to Anon, then realized that a picture is worth a thousand words, hence this new post. The bottom line is that since the market broke the channel and moving average, we're in no man's land right now. You must be cautious because the market does not have a clear direction as it did when it was in its downtrending channel or when it was in its uptrending channel. Until a new channel forms, the market is in limbo (stage 3).
Here is our comment to Anon on the previous thread...
Anon, there are four stages...
Stage 1- sideways after a downtrend - choppy, breaks the moving average many times in both directions
Stage 2- uptrend (price is above uptrending moving average)
Stage 3- sideways after an uptrend - choppy, breaks the moving average many times in both directions
Stage 4- downtrend (price is below a downtrending moving average)
These stages typically take months or years to play out, using the 200dma as the average. We've applied the concept to the current short term rally just to get a better idea of how to time it for ourselves. Right now, the market as a whole is no doubt in a Stage 4 downtrend. There's no disputing that. It is trending lower below a downtrending 200dma. If you zero in on just this little multi-week rally that we're having, then the market is in a little Stage 3. It is no longer in a Stage 2 uptrend. Nor is it in a Stage 4 downtrend... yet. Once it enters Stage 4, if it does, then you have to assume it's going to zero until it stops falling. It may just be resting right now, consolidating the recent huge advance of the past several weeks. We may start a new Stage 2 uptrend after this consolidation is over, or we may fall into a Stage 4 downtrend. Nobody knows. We sold some DDM when the channel broke because we had left the Stage 2 uptrend, making the market riskier going ahead. It isn't that we thought it would tank, it's just that once the channel was broken, the odds of it rallying further were much less than they were when the channel was intact.TA is not meant to give you foolproof buy and sell signals, although sometimes it does. What it really does is helps you put the odds in your favor over time.Right now, the market is less decisive than it was when it was in the channel. It could go either way. We buy the dips when the market is in the channel. Right now, we would not buy the dips because if one of these dips makes a new low, we may be starting a Stage 4. You see, the stages help you decide what mood to be in... bullish, cautious, bearish, etc.Right now, we're in a short term Stage 3, so our mood is neither bullish nor bearish, it's cautious.

Wednesday, April 1, 2009

Moving Average

Click chart to enlarge
This chart of the Dow which goes back to the start of the recent rally shows a change of character for the index. It is now trading below its moving average, which is starting to turn down itself. This line which served as the approximate support level during the rally is now resistance. The one big drop we saw last week, which decisively broke the trend channel and moving average changed market sentiment... at least for the time being. This is no longer a "buy the dips, rally mode" kind of market. It's now a nervous "which way next" kind of market. It's too early to call it a "sell the rallies" market, but another lower high (rejection at the moving average) would change that.

Tuesday, March 31, 2009

Citigroup Fraud

This is not the first time the question of fraudulent banking activity has been mentioned on this blog. We have a credit card with Citi. Last month's bill was paid in full, more than a week before the due date. This month's bill has a finance charge for the unpaid portion of last month's bill. Of course, there was no unpaid portion. So we called Citi and asked how they could charge a finance charge on a zero balance. They confirmed that we had paid last month's bill, and had paid it on time. They could not answer the question. Finally, they agreed to send us a check for $50.
We've had credit cards for over 20 years and have never made a late payment, and have never paid less than the full balance. Of course it's hard to believe that a company as large as Citi would be blatantly defrauding their customers. We began to wonder if in these desperate times, could Citi be resorting to desperate measures to stay in business? Has the government given them amnesty for minor "errors" to keep the failing bank alive? Of course we don't know what's going on behind the scenes at Citi, or any other bank for that matter, all we know is that this is the first time in 20 years that we've had reason to call them.
Check all of your bank and credit card statements more carefully than you typically would. Something just doesn't feel right.

Updated Chart

Click chart to enlarge
Above is a chart of the Dow including Monday's action. Needless to say, there was a simultaneous and decisive break of the channel and moving average at the open on Monday. These short term chart patterns are not as reliable as longer term patterns, but if TA is any guide, market sentiment changed this morning. We should continue to sell off from here, but of course anything is possible. Today we sold the other half of what we bought at Dow 6700/6800. We were hoping for more upside, but there's a lot of risk now that we've been so blatantly rejected once again at the 75dma. We're more interested in buying than selling now, and are hoping for a return to the lows. If instead the market moves against us (goes higher), our next sell target is Dow 8400/8500.

Friday, March 27, 2009

New Channel

Click chart to enlarge
We drew a new linear regression channel on the chart of DDM, beginning at the breakout on March 10th through today. The recent weakness has brought the slope of the channel down a bit, relative to the slope it had when the rally was only 8 days old. The longer a channel, the more significant it becomes. The bottom of the channel is running parallel to the moving average, increasing the chance that other traders will pick up on it. This is a 35 minute chart for no other reason than that all 14 sessions of the market's current rally fit on the screen.

Thursday, March 26, 2009

75 DMA

Click chart to enlarge
The chart above is a chart of SPY (S&P500). This way, we can't be accused of having a myopic, Dow-centric view of the market. The chart is virtually identical to the Dow in that both charts are flirting with their moving average. It happens to be the 75dma, but the actual number is irrelevant. All that matters is that it's the moving average that it hasn't been able to break for the past 8 months. The 4 small diagonal lines show the points where the index got rejected at this line. Needless to say, we're at a critical point. Do we break out or do we go for another test of the lows? We have no idea. All we know is that if the market drops, we're going to begin accumulating shares rapidly. If it continues to move higher without correcting, then we'll unload a small handful of shares at each resistance level. The next of these levels is at SPY 880 (Dow 8400), the Feb high. For the record, the 100dma is at SPY 840 (Dow 8125), within easy striking distance for tomorrow, and the 200dma (the important one) is at SPY 102 (Dow 9526).
Regardless of how you want to play it, it is important to take note that if the indexes break this moving average, it will be the most bullish move they've made since the start of this whole debacle. Don't expect fireworks, but do mark the day on your calendar.

Monday, March 23, 2009

12 Month Chart

Click chart to enlarge
Above is a one year chart of the Dow. The moving average shown is the 75dma. It is not as significant as the 100 or 200dma, but it's what the Dow has been responding to (bouncing off of) all year long. In our minds, this makes it more significant than the 50 or 100dma. We're going to sell about 1/4 of our shares tomorrow, hopefully into strength. If the Dow should break the downtrending resistance line and moving average, it should be seen as the strongest move it's made for the past year. These lines are not set in stone. There is an art to drawing channels, it's not an exact science. The channel drawn could be off by a couple hundred points depending on its slope. Although we use a computer generated center line, the start and end points of the line can alter its slope. Nevertheless, the basic concept is sound. A significant break of the channel and moving average would suggest that sentiment wants to change for the better. It would not rule out a return to the lows, but would make it more likely that the recent lows will hold. If instead we start dropping from here, there would have been no change to market sentiment with this recent rally. In that case, it would just be another bear market rally, setting latecomers up for rapid losses.
Either way, this is our cue to become a little more defensive. We bought at Dow 6800 or so. Selling those shares here just makes good sense, considering we'll still be holding the majority of our stake.

Friday, March 20, 2009

Channel Break

Click chart to enlarge
The chart above is a chart of DDM... same thing as the Dow for the intents of this post. The channel has clearly been broken. It's too early to say if this is the start of a return to the lows yet, but it's fair to say that the momentum has changed. This is no longer a dip within the channel, but rather a change of sentiment for the market. At least for the short term, there's been a shift from the recent "buy the dips" mentality to a new "sell the rallies" mentality. If we gap up on Monday, people will be looking to sell at the recent highs rather than buy into the upward momentum. Like we said in a previous post, when the channel breaks, it is a swift and decisive move. It doesn't just slowly go sideways through the support. It just drops.

Thursday, March 19, 2009

Dow Update

Click chart to enlarge
The Dow is just riding up the bottom of the channel today. Despite a triple digit loss earlier, it's an uneventful day as long as it stays within the channel. This channel is so well-defined and has been validated (tested) enough times that there's no doubt a chart like this is up on the computer screens of traders around the world. When the Dow finally does break down from this channel, the initial drop will be very significant. You'll know then that these channels are used by many. We'll post it here when it happens.

Intraday Dow

Click chart to enlarge
The chart above is a chart of the Dow on an intraday basis. Each candlestick (bar) represents 20 minutes. The chart shows the entire recent rally from March 10th to present. We would recommend holding tight until this chart breaks support. If you want to sell at the top of the channel and repurchase as it returns to the bottom, you could theoretically increase your shares at no cost. We have no intention of selling any shares as the market rallies unless the top line is broken, or the Dow reaches the top of its larger, downtrending channel at approx 7700/7800. Other than those occurences, we will continue to buy the dips. We continue to believe that we have hit a bottom for the market, although the economy itself will not appear to improve for 6-12 months.

Wednesday, March 18, 2009

Updated Dow

Click chart to enlarge
The chart above is an update of the Dow. We're nearing the top of the channel and moving average. When people ask should they buy or sell here, the answer is it depends on how invested you are. Which is why no one can really advise you. We're only 30% invested, with the goal of investing more into the indexes. If we were to sell any part of our holdings, it would only be tempting at 7800 or so. And in that case, we'd only be selling the portion of our shares which were bought at 6800. We're not focused on selling, but rather on continuing to accumulate shares for the long term. That is, until a new leading sector emerges. At that point, we'll shift from the indexes to the leaders of that sector. That shift could be a couple years away.
We have inside knowledge of the health of the high end real estate market. It is an excellent barometer of the health of the overall economy, and perhaps even a crystal ball. We find that after a two year lull, wealthy speculators are starting to buy land and build houses again. It may seem early, but these are people with close ties to the major brokerage houses in New York. Billionaire investors are scooping up land at firesale prices, and are beginning to revitalize the otherwise slumping local economy. This is the earliest sign that a major turn in the economy is brewing. It will likely be about a year before this spending trickles down into the pockets of the plumbers and electricians and such, but the turn is coming. Our guess is that 6500 will be the bottom. A return to 6500 should be seen as a great opportunity, as it will not be long before others realize that a major shift in the economy is just around the corner.

Saturday, March 14, 2009

Dow Channel

Click chart to enlarge
The Dow didn't quite reach the bottom of the channel, but we did at least buy a small amount of SSO on the dip. We'll sell that same amount if the Dow reaches 7600 or so. The top of the channel is currently at about 7700/8000, depending on whether you view a log chart or arithmetic chart. Either way, the line parallels the moving averages, giving its slope further validity. This resistance line connects points from September, January, and February, which we believe makes it long enough to be showing up on screens on trading desks everywhere. In this range (7700-8000) is where we think the current Madoff rally will pause. We may have a retracement of some of the recent gains before making it to the top of the channel, but the odds do favor a return to upper 7000's.
From there, it's anyone's guess as to whether we break out and move higher, or retest the recent lows. The poll we have in the left sidebar of the blog suggests that investors remain bearish. Of course this is a small handful of voters, but the votes are more decisive than in previous polls. The majority of our readers believe we're ultimately headed for new lows. We hope this is the case, as we've been looking for a washout move significant enough to convince investors that we've hit a permanent bottom, giving them confidence to re-enter the market for the long term. We think that when the eventual recovery happens, both for the market and for the broader economy, that the snap back will be fast and steady. Everything today takes fractions of the time it took in the past. The market may collapse faster, but if our common sense is any guide, the speed of the recovery will be equally unexpected.

Tuesday, March 10, 2009

Bought SSO

Click image to enlarge
There now exists a piggy bank in the image of con artist Bernard Madoff. It's made of faux bronze, fitting for a faux money manager. The plug at the bottom is fused shut, so money deposited in the bank is lost. That is, until you smash Bernie over the head with a sledge hammer. Hats off to Palmer Murphy, the NYC artist who created it.
We bought some SSO today, enough to bring our long positions back up to 30%. They had deteriorated to just 24% of our account given the selloff of the past few months. We don't intend to do any more buying unless the market breaks down to new lows. The fact that Citi has been operating at a profit for the past several months is great news... if it's true. It would mean that we, as taxpayers, would no longer have to bear the burden of paying Citigroup's bills to keep them alive each month. When we were, it was costing us $15B a month, $3B more per month than the cost of the war in Iraq.
If today does turn out to be the start of the next sustained rally, then you're not too late to buy. We could potentially rally another 1,100 points to Dow 8,000, which is where the 75dma currently is. We're mentioning the 75dma because the Dow seems to keep bouncing off of this line each time it rallies. A break of this resistance would be very significant in that we haven't traded above it since last June. We returned to it in September and then again in January, but haven't broken through it. It therefore is the strongest resistance level the Dow has right now, despite being an "odd" number. It coincides with what once was support for the Dow, that 8,000 level that the market struggled to stay above for 4 months before finally breaking down in February. We would certainly do some selling near the 8,000 level if it turns out to be the next stop for the market. Until then, we remain focused on buying somewhere near the bottom of any major selloff.

Friday, March 6, 2009

Madoff Kills Two

Bernard Madoff, now the most vilified man (if you can call him that) in America, killed two people recently. A plea bargain is being sought in the case in order to protect Madoff from serving justice for toppling investor confidence, bankrupting charities, leaving widows impoverished, and killing the two men shown above. Madoff will likely face a $75 fine when the swift arm of the SEC slams down on him.
At left is pictured William Foxton, who put a bullet in his head after learning that his family's life savings were wiped out after being invested (if you can call it that) with Madoff. At right is pictured Rene-Thierry Magon de la Villehuchet, who slashed his wrists when he learned that his family's life savings had vanished thanks to an investment with Madoff.
Meanwhile, back at the ranch, Bernie and wife Ruth are sipping margaritas, that we're paying for, in their luxury apartment, that we're paying for. The margaritas they're enjoying are costing each American taxpayer just fractions of a penny. Which isn't so bad. The apartment, however, is costing each American taxpayer 7 cents. We don't know about you, but it pisses us off that we're paying 7 cents to fund this guy's retirement. In fact, we feel he owes us. We used to love this country, but we're really on the fence now. Every day Madoff is free on bail is a slap in the face to the rest of us. We're spending the first 19 seconds of our work day working for Bernie and Ruth! That includes the cost of the margaritas, by the way. If everyone in America were to punch the clock 19 seconds late each morning in protest until Madoff is behind bars, it would send a message to Washington that we're not paying for this!
We think Bernie should be brought up on manslaughter charges and be behind bars on that basis alone. In all other aspects of life, if you contribute to a person's death, you're partly responsible. Apparently Wall Street has written its own set of rules, in which our role as the State has been reduced to just to paying the bill.

Thursday, March 5, 2009

Ready to Buy...

Click chart to enlarge
Here at the Snotwheel Group, we're getting geared up to buy the indexes, but aren't pulling the trigger just yet. We're under water on the first layer of index ETF's we bought months ago, so we've been waiting for a washout move upon which to double or triple our current number of shares. Remember, as it goes lower, it becomes less and less expensive to double your shares. In a sense, a falling market gives you leverage, provided you're not fully invested.
We haven't pulled the trigger yet because we're still eyeing the channel, waiting for the market to reach a position where it will be as oversold as it's been at its worst times since the start of this global depression. The market's level of "oversold-ness" can be determined by how far below the moving average it is, on a percentage basis. For example, on 10-16-08, the Dow hit a low of 8,200 while the 100 day moving average was at 11,300. In other words, the Dow was 27.4% below the moving average. On 11-21-08, the Dow hit a low of 7,450 while the 100 day moving average was at 10,423. At that low, the Dow was 28.5% below the moving average. The chart above shows a 90 day moving average, just fyi. It does not matter what moving average you use for this calculation, as long as it's the same one for each comparison.
It's safe to say that when the Dow is 27% below its 100 day moving average, it's as oversold as it's been over the past couple years. Today, the 100 day moving average is at 8,360. For the Dow to be 27% below this, it would have to be 6,100. For it to be 28.5% below it, it would have to reach 5,977. Anyway, this gives us a rough idea of where we would be looking to buy. Of course, there's no guarantees it will reach that target, no guarantee that it will stop falling if it does reach it, and no guarantee it won't just go slowly sideways or lower from there. Nonetheless, as a long biased retirement fund, this is where we will focus our next layer of buying.
It should be noted that if anyone wants to engage in such "risky" activity, it would be a good idea to check such numbers against the S&P500 index, as the Dow is the worst performing index of late. We intend to buy SPY and/or SSO, not the Dow this time around, so we'll be checking the math on a chart of SPY accordingly.
If the market does not reach those lows, then we just stay put. There is no rush to buy at any point that does not represent a severely oversold condition. If the market rebounds early, the next oversold condition will not be at 6,000. It may be at 5,000 or 4,000. We are not interested in buying at 6,000 per se, but at 28% below the 100 day moving average, whatever the market's level may be at that time.
Tomorrow morning we will get the all-important jobs report. This will determine the direction of the market, and if it is negatively received, we could easily hit 6,000 by early next week. If the market continues to crash over the next few sessions, and you intend to buy, it's best to turn CNBC off and just focus on nothing but the market's level. The media will be overwhelmingly negative, and it will appear that the bottom is falling out of the market. There could be talks of runs on banks and such, along with many excuses as to why the market is falling. Truth is, it is only falling because people are selling. And people only sell for one reason... they think it's going lower and they don't want to lose money. It's a self-fulfilling prophecy. If you intend to buy, don't get caught up in the emotion. Just pull the trigger when it feels most scary to do so, and then just walk away.

Tuesday, March 3, 2009

GE

Click chart to enlarge

One of the more ominous looking charts is that of GE. Currently (10amEST), the Dow is up 50 points, and GE is down over 5%. Just judging by the chart, GE looks like it's in every bit as much trouble as C, BAC, and the automakers. With chart activity like this, it's very possible that we see GE drop to $2 and become the next big news story, complete with bailouts and talks of bankruptcy. Whatever is going on at GE, one thing is clear... investors are running for the exits.

Monday, March 2, 2009

Letter to AIG

To Ed Liddy (AIG CEO),
I understand that you received $40B from TARP in November, and are now set to receive an additional $30B. More bailout money has gone to your company than any other thus far, and even more may be coming your way.
As an individual American taxpayer, I alone have sent you $700, effectively paying your bill for the amount of marble flooring visible in this photo of your office building's lobby. It just so happens that I was in the middle of renovating my bathroom when I received the bill for your marble, which means that I can no longer afford to finish my own project. I had set aside the correct amount to finish my bathroom floor, but did not count on having to pay for yours first. Thanks to your incompetance, I will be without a bathroom for the next year, and am therefore writing to ask that you leave your facilities open to me 24/7 until I can recover from the burden of having to pay your bills.
Thank you for your cooperation.
Sincerely, Al Smith
.....
P.S. - Considering your company lost $61.66B this quarter, don't your executives have anything better to do than hang out in the lobby posing for photos?

The Dow

Click chart to enlarge

The chart above is a log chart of the Dow over the past 7 months. Channels are more reliable on the way up, but we've nevertheless drawn a downtrending channel to attempt to gauge how oversold the market currently is, relative to recent levels. We know that the slope of the channel is valid because it parallels the moving average, and roughly approximates the highs and lows of the market for this time period.
The slope of this channel is steeper than most bear markets. The oversold levels reached in October and November were very extreme. There is no guarantee that we'll reach such extremes again, but recent history is the best guide we have. If the market were to plunge over the next few days, we could reasonably expect it to stop at 6,300, with 6,000 being the extreme low. Of course, the longer the drop takes, the further the lines move down.
Although buying in a bear market is not safe, the further the market drops below its moving average, the better off you are. The best case scenario (for us, anyway) is a hard drop directly to the low 6,000's. At that point, we would at least double our long positions. There would be a good chance that from there the market would either consolidate sideways for many months, or move higher. Many are now calling for Dow 5,000. We don't need to see Dow 5,000 in order to tempt us in, we'll feel comfortable adding in the low 6,000's, no matter how scary the environment is if/when we get there.

Wednesday, February 25, 2009

CF Industries

Click chart to enlarge
The chart above shows a chart moving from Stage 1 (sideways consolidation at the bottom, to Stage 2 (uptrend). It's a chart of CF Industries. Although this is exactly what the breakout marking the end of Stage 1 would typically look like, this may not be one of those times. Agrium placed a hostile takeover bid for CF Industries, causing the stock to spike.
Either way, it's still important to note that the fertilizer stocks are faring better than the broader market (demonstrating excellent relative strength). The takeover attempt is yet another healthy sign for the sector. First, it tells us that AGU has quite a bit of cash. Not bad, given the times. Second, it tells us that insiders see value in their competitor's stock price. What better vote of confidence than a vote from insiders themselves about what their stocks are worth? We normally only find out what the insiders knew after it's too late. Their vote to attempt to buy a fertilizer stock at this time suggests that they are fairly valued factoring in every metric including whatever corruption only insiders are typically privvy to. It's an inside peek into the health of these companies, both for CF and AGU.

Monday, February 23, 2009

Cramer

Click chart to enlarge
We love Cramer's optimism and passion for his work, but it is nevertheless important to question his advice from time to time. Many blogs have been set up specifically to bash Cramer. This is not one of them, but we can't help but notice how his "recession-proof" stocks have fared.
In late 2007, Cramer warned that the market looked very ominous. He suggested that investors "stay in the game", but exercise caution. He chose a handful of "recession-proof" stocks that were intended to protect your capital while keeping you invested.
The two stocks we remember him choosing were FWLT (Foster Wheeler), and FCX (Freeport McMoran). FWLT is down about 71%, and FCX is down about 75% since that recommendation.
The chart above is of FCX.
On March 14, 2008, Cramer chose a new group of "recession-proof" stocks. Again, intended to preserve your capital while keeping you "in the game". This time, he chose AVP (Avon), HLF (Herbalife), and TUP (Tupperware). Since that recommendation, AVP is down 53%, HLF is down 60%, and TUP is down 56%.
Without being overly critical about Cramer's investing acumen, it's important to note that no stocks are "recession-proof". In a bear market, the best approach is to avoid ALL individual stocks. Make a note of that, because no bear market in history has ever rewarded stock pickers.
Here's a link to the article/video in which Cramer chooses his "recession-proof" portfolio...
The stock prices in the text of the article are constantly updated, but if you watch the video, you'll see that the stock picks were made in March when the stocks were much higher.
(Please vote in our updated poll)

Thursday, February 19, 2009

Long Term Dow


Click charts to enlarge
The chart at the top is a chart of the Dow from 1969 to present. It's a log chart, wherein each vertical unit equals the same percentage as the others. This removes the parabola effect charts tend to have when viewed long term.
The way we see it, from 1964 (not shown) to 1982, the market went sideways (for 18 years). Then it expanded from 1983 to 2007.
2008 changed everything, and we've now entered a new stage for the market. Although we've drawn the trendline in such a way as to make it look like 2008 was the start of a whole new macro-trend for the market, there is another possibility. 2000 may have been the top, and we've been in a sideways market ever since. This certainly would jive with the 18 year cycles the market typically has, as shown on the lower chart.
This chart shows that the market goes up for 18 years, then consolidates for 18 years. If 2000 was the top, then 2018 will start the new bull market. Good news, we're halfway through the market's consolidation phase!
If we truly are in the midst of an 18 year consolidation which began in 2000, then the market's highs and lows may have already been carved out... more or less. Of course, 1000 points on this chart just looks like a blip. Nevertheless, a look at the market's last major consolidation (from 1964 to 1982) shows a market that moved in a 50% range, from 1,100 to 550. This is very similar to the range we're trading in now, from 14000 to 7000.
If you believe that macrotrends repeat themselves, then you would be looking for the market to bottom soon, rather than looking for the Dow to continue its slide to 5,000.


Eric & Shana

The SEC has compliance officials whose job it is to make sure investment firms comply with the rules. In turn, investment firms have rules-compliance lawyers to prove their firms are in compliance.
Eric Swanson (top left) was a top SEC compliance official who worked for the SEC when they found no problems with Bernie Madoff's books over the past few years.
Shana Madoff (top right) was a rules-compliance lawyer at Madoff's firm, and is the daughter of Bernie Madoff's brother, Peter, who was head of compliance at the firm.
So on one end you have Eric Swanson, the investigative arm of the SEC, dealing with Shana and Peter Madoff on the other end, who both work to provide proof that the firm is following the rules.
The burning question is this... why are Eric Swanson and Shana Madoff looking so friendly in the picture at the bottom? Is it photoshopped? After all, they are opposing forces in the fight against corruption on Wall Street. These two, of all people, should be at arm's length. Our trust in the backbone of our nation's financial system, free trade, depends entirely on these relationships being kept strictly at a professional level. Would you be suprised to find that Eric Swanson and Shana Madoff are actually a married couple? One can only imagine what conversation must be like at their Thanksgiving dinner. Truth is stranger than fiction.

Wednesday, February 18, 2009

LDK

Click chart to enlarge
After the bell today, LDK warned investors that it will post a loss for Q4 2008 when it reports earnings on March 11th. This will be the company's first quarterly loss. The loss comes amidst lower demand and falling prices... a lethal combination for any company.
We may be way off base here, but our guess is that the stock will stay in the single digits for all of 2009, and may even fall below $5 at some point. If the company survives this recession/depression, its stock will not show signs of life for at least another year. Bottom line... you should not look at tomorrow morning's gap down as a buying opportunity. For at least the next 12 months, your money will be better off under a mattress than in LDK.
We once owned and supported LDK, but jumped ship when the stock broke down from its uptrend on 10-03-2007 when an insider leaked rumors of an accounting/inventory scandal. At that point, we decided that Chinese business antics, although entertaining, were not something we wanted to expose our capital to.
Long story short, we'd seen similar tragic companies in the past, and tried desperately to warn investors that the company was a rotten apple, but found that for some unexplained reason, it had developed a cult-like following. Its investors did not approve of our warnings, which eventually led to us starting this blog. We continue to dislike LDK primarily because its CEO holds almost all of its outstanding shares. Now that we're in an economy where people are struggling to buy milk, plans to put solar panels on their roofs have been shelved. Meanwhile, oil prices have plummeted and now they've forgotten they wanted solar and yada yada, you get the idea.

Tuesday, February 17, 2009

Gary

We haven't been checking in on Gary's performance lately knowing that many of his stocks reversed course and ruined his overall performance. Still, suprisingly enough, his approach is resilient enough to beat Buffett. Since Gary chose his stocks 15 weeks ago (on November 3rd), he has lost 5.0% compared to a 27.2% loss for Buffett's Berkshire Hathaway, and an 18.2% loss for the S&P500 index. For the record, we actually like Warren Buffett. He did not swindel investors out of their capital. Anyone working on Wall Street and not blatantly stealing from the investing public is a hero by today's lax standards.
Remember, Buffett is outperforming other big names like Icahn and Kerkorian. All in all, despite "Gary version 1" being a failure of sorts, his performance makes the experiment nonetheless compelling.
What Gary taught us...
Some of Gary's small caps made sharp reversals of trend, while his large cap names remained more stable and predictable. We knew this going into the experiment, and were told by readers that the imbalance was a flaw in the system. We took the stance that "Gary version 1" was allowed to be flawed. After all, he's a chimp. His performance will theoretically improve with human interference in later versions... or at least we hope.
Large cap 3M (MMM) was one of Gary's shorts. It did exactly what it was supposed to do, and probably will continue to. On the other hand, one of Gary's longs, LPHI, did the opposite of what it was supposed to do. It reversed course. LPHI trades approx 200k shares a day compared to MMM's 6 million.
Another lesson from "Gary version 1" is that short term timing is critical. Gary bought his stocks at all points in their channels, paying no mind to short term timing. He spent a long time treading water, or underwater, on stocks that eventually moved in his direction.
And finally, he taught us that when a stock breaks its channel and/or moving average, it should be replaced by a new candidate.
.......
Of course we knew these things going into the experiment, but at least now we have a control for future experiments. We're going to start up "Gary version 2" very soon so we can see if human intervention can get us closer to our goal. And what is that goal? The goal with the Gary experiment is not to create an environment in which we can all poke fun at the "pros" and feel better about our own performance, but instead to create a system that works over time, regardless of market direction. In our opinion, there is very little that is predictable about the stock market. Even fundamentals are sometimes thrown by the wayside, and therefore cannot be trusted. There is one thing, however, that seems to be true again and again. And that's the overall compulsion stocks have to continue in the direction in which they're currently headed. That is to say that stocks spend the majority of their time moving in one direction, and a small amount of their time reversing course.
Our Gary experiment is an attempt to harness some quantity of that phenomenon and package it into a simple system that can generate profits with little maintenance consistently over time regardless of the market's sentiment.

Can't Buy Here

We wanted to buy some more SSO when the Dow reached its November lows, and now that it's happening, we find ourselves unable to pull the trigger. And it's not because of fear, or because we want a better price. It's because we strongly feel that investing in any stock or index fund at this time is a "yes" vote for a system that supports criminals such as Madoff. And now there's Stanford, another $50B investigation that surfaced this past weekend.
The government has demonstrated to the public that corruption and theft on Wall Street is an acceptable practice. How can we vote "yes" when we don't agree that corruption and theft are acceptable? We cannot in good faith support a system that rewards bad behavior. It simply goes against our principles.
So while we struggle with this crippling moral dilemna, here's something to think about...
Toyota, now the world's largest automaker, posted their first annual loss since 1980. Until now, the Japanese automakers were seen as bulletproof, at least compared to their domestic counterparts. If there was any doubt about this recession/imending depression being global, there should be no doubt now. Toyota (TM) actually makes a good short, as it's in a Stage 4 downtrend, yet close to its moving average. We have nothing against the company itself, it's just that with U.S. automakers selling at less than $2 per share, a fair price for TM in this economy is probably in the ballpark of $10 - $15. GE may even be below $10 soon.
With oil making new lows every day, you would think there would be some relief at the pumps. But then, you'd be wrong. Oil companies are getting rich, and the wealth is certainly not going to their shareholders. Well, except for Cheney and other high-ranking government officials. If you want to question Cheney in depth about his retirement package with Halliburton, we hear he'd be happy to take you on a "hunting" trip.
But it's not all bleak out there. Here's a silver lining...
There was a time when investors, in addition to doing all other fundamental research, faced the overwhelming task of trying to guess which privately-run company was being truthful. Now that the government is taking over our banks, insurance companies, automakers, etc, investors can look forward to a new era of truth in accounting practices! With the government at the wheel, we expect this new era to be corruption-free and completely transparent!
Ok, the Dow is down 280 now. Maybe other investors don't share our enthusiam about the new, government-run corporate America, backed by the full faith of a government that rewards criminal activity. Wait a second, we're back to where we started this post. So much for a silver lining, this country's going to hell in a handbasket! The only thing that could make us even have a sliver of hope in restoring our faith in America would be to see Madoff and his sons behind bars. From there, we could start to repair the psychological damage the S.E.C. has done to our confidence in Wall Street. Until then, it's really, really hard for us to pull the trigger.