Wednesday, July 30, 2008

PetroBras (PBR)

Click chart to enlarge
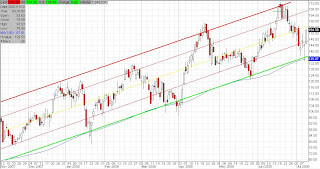
Categorize this one into the "fun trades, don't bet the farm" folder. This chart does not appeal to us because the channel is too broad, so it is not one we would normally be interested in.
However, it deserves a closer look. It's the chart of PetroBrazil, PBR. After overshooting the top of its channel by a mile, it has finally reached (and bounced off of) its bottom. PBR is similar to RIO and RIG, which are showing the same pattern. It's not just an intriguing chart, it has fundamentals in spades. PBR is the single largest holding of Ken Heebner's CGM mutual fund, comprising almost 9% of its value. He has not done well on PBR this year, with the stock down over 5%. We're betting that with Ken's stellar track record, he's on to something. Buying a stock with these technical and fundamental merits clearly puts the odds in your favor, particularly when you buy low.
We're going to buy a small amount of PBR here, making sure to allocate cash to average down with. On a longer term chart, PBR has yet to revert all the way to the bottom of its trend channel, although RIO and RIG both have. You can read this in one of two ways. Either PBR has some selling left in it, or it has more relative strength than the others. We chose to use a different metric, comparing it with the Dow instead. The Dow's July low was lower than its March low. PBR's July low was higher than its March low. If PBR managed to put in a higher low than it did 4 months ago all the while with the Dow plunging, what will it do while the Dow rallies? Our guess is that the huge drop from overbought levels has scared the weak hands out of the stock, and now it's time for both PBR and Mr. Heebner to have their day. Here is a link to Ken's holdings...

The Dow

Click chart to enlarge
Thanks to its putting in a "higher low" this week, the Dow is once again in a short term uptrend. Make no mistake, the broader trend is still down. We have to decisively break and close above the 200dma in order to even start talking about a new bull market. But in the meantime, we'll be very happy just to see the market reach that milestone.
So which comes first, touching the 200dma or a break of the new uptrending support line?
You don't have to be a rocket scientist to know that the broader market had reached very oversold levels in late June / early July. We started a position in DDM a few weeks ago knowing that eventually we would get a bounce that leads to an uptrend. And here it is. Our guess is that the Dow will touch the 200dma before it breaks its new support line. The move will not be quick nor easy. With unpredictable spikes in oil, the Dow is not in for a smooth ride. Nevertheless, we expect it to more or less remain within its new uptrending channel until it reaches 12300 or so.
As part of a long term portfolio, adding DDM here makes sense. As always, extra cash should be allocated for averaging down. While we do not advise that people average down into downtrending stocks (we don't even advise people hold them), we do believe in averaging down into indexes, mutual funds, and the like. The diversification these investment vehicles offer make them prime candidates for investors/traders who are skilled at committing capital in stages in such a way as to make sure the majority of their capital is invested near the bottom. With an individual downtrending stock, this same approach is most often a one-way ticket to financial suicide.

Fertilizer rally

Click chart to enlarge
CF is off to the races. It feels too far too fast to us. The other ferts need to play catch up while CF stalls or retreats. But overall, no one can deny today's strength in this sector. The more momentum it gains, the more people will jump on board... leading to even greater momentum. Why CF has been outperforming the others lately is anyone's guess. We don't look at MOS, POT and AGU as being weak. We see today's action as a sign of strength for the entire sector. If the leaders (now CF and TRA? nearing new highs!) remain strong, they will ultimately take the laggards along for the ride.
We'll be looking to scale out of CF if it nears the top of its channel near 185. The short horizontal lines are our average sell and buy prices. Even if we sold here, we would have a decent profit. But we don't sell leaders with explosive earnings growth and p/e's of 10 at midchannel during a rally. That would be breaking our rules.

Tuesday, July 29, 2008

Fertilizer Still Going


Click chart to enlarge

We said we'd wait until the close of the day today to decide whether or not we would stay in the fertilizer trade. Nothing about today's action had us running for the exits, so we're going to stick around. CF (chart above) continues to form a descending triangle, creating a strong resistance line. We're looking for a break of that line from all of the fertilizer stocks at the same time. That would be the ideal scenario.
After extremely strong earnings reports from CF and MOS last night, the p/e's of these stocks just dropped considerably. If the reports were so good, Snot, then why didn't the stocks reach new highs today? Have patience. Sectors go in and out of favor, for no particular reason whatsoever. If the fertilizer stocks rally three weeks from today, CNBC's talking heads will be chalking the rally up to continued strong earnings. The fact that they didn't completely break down today was what we were looking for.
The continued weakness in commodities cannot be ignored. As much as we'd like to see the fertilizer stocks make another run, we have to be realistic and accept that the world is crashing down all around them. It's troubling to see OIL break its 100dma. We expected that support level to hold, and perhaps give way to a rally. We are watching the fertilizer stocks closely to make sure they don't break down due to broad concerns about the current weakness in commodities.
Despite many warning signs, the fertilizer stocks are hanging in there. They are hanging on by a thread, but if they can weather this storm, they may come out of kicking. We're going to hang on to them until proven wrong.

Thursday, July 24, 2008

Potash (POT)

Click chart to enlarge
The chart above is a two year logarithmic chart of POT. As much as its current action is a nail-biter, we have to keep things in perspective until proven wrong (which may happen tomorrow) . Despite the recent slump, POT has yet to close decisively below its long term trend channel. We don't have to tell you how critical these support lines have now become. The longer they are, the more significant a break of them ultimately is. We are at an extremely critical point in POT's cycle, where the next few days literally decide its fate for the next several months. If support is broken, it will either go the way of CROX, or it will consolidate sideways for many, many months before regaining the confidence of investors eventually allowing it to move higher. While a consolidation like this is a healthy and necessary part of a company (and its stocks) natural growth cycle, we never stick around for them because the risk outweighs the reward. We've found that most stocks that break through the bottom of their trend channels never make new highs again. The euphoria that brought them to their peaks is rarely re-created. Companies that do have multiple bull runs go on to become the largest companies in the world. They are the AAPL's, MSFT's and GOOG's. For every one of them, there are hundreds of one-hit wonders that simply disappear into the annals of stock market history. There is no reason to place a bet with those odds, which is why when most stocks break support, they crash and burn, never to be heard from again.

CROX

Click chart to enlarge
Unfortunately, we are not able to short individual names because we trade individual and business retirement accounts, in which margin is not allowed. It's unfortunate, because our performance was far better when we had simultaneous positions in uptrending and downtrending stocks, and it gave us peace of mind in case the entire market collapsed.
We still keep a list of shorts just for fun, and CROX has been on that list since it broke down in November. We never had reason to remove it from our list, and now CROX is set to open down more than 50% tomorrow at $4.50
We are looking into a way to transfer some of our assets into a marginable account in order to take advantage of the market's 'dark side'. It always seemed easier to us to profit from downtrending stocks considering that fear accelerates faster than greed, causing stocks to fall 3 times faster than they rise.
Almost all stocks eventually go to $0 (effectively if not literally), and they spend the vast majority of their life cycles going down. For this reason, most traders lose money in the market because by going long, they are trying to swim upstream.
We have zero faith that ugly rubber shoes will ever make a comeback. Any CROX bagholders should have bailed out a very long time ago, and should send a stale fruitcake to Karen Finerman.


Tuesday, July 22, 2008

CF, POT, and MOS


Click charts to enlarge
The chart at the top is CF, the chart in the middle is POT, and the chart at the bottom is MOS. What we're looking for, at some point, is a break of the short term resistance line that these stocks have formed since they topped out in mid June. This same basic pattern has played out several times with these stocks in the recent past. A break of the line in each case has been followed by a strong rally, several weeks in duration.
Whether or not it will play out this way again is anyone's guess. We can only tell you what to look out for, not what will happen. There is a theory that traders should buy into strength. Following this theory, one would buy aggressively on a break of the resistance lines drawn above. While we understand the logic of buying the breakout, we prefer to buy uptrending stocks on weakness instead. This gives us some breathing room should the breakout fail.


Monday, July 21, 2008

Commodities Intact


Click charts to enlarge
On short term charts of the commodities, they appear to be in trouble. But taking a longer term perspective shows that they are still within the limits of their channels, as shown on the charts of DBA and DBC above. Granted they are at the bottoms of their channels and looking precarious, but despite recent weakness, it is too early to declare an end to the commodity bull.

Apple (AAPL)


Click charts to enlarge
We don't comment much on AAPL because it doesn't fit our criteria of being in a well-defined uptrend. Today, however, it is worthy of note, because it releases its earnings report after the bell on Monday (July 21st). The chart at the top shows AAPL's recent activity. It's in a downtrend, approaching short term oversold. The chart below it shows AAPL over the past 3.5 years. It's broader trend is up, but it swings wildly above and below its overall channel. The point of this post is that AAPL is at the center of its multi-year trend channel, and therefore, it is impossible to gain any predictive value from its chart as to how it might react to its earnings report. If it were oversold (as it was in mid 2006 and early 2008), or overbought (as it was in early 2006 and especially in the second half of 2007), you could rest assured that the odds would be in your favor if you just simply placed a bet that AAPL would revert to the center of its channel.
In the abscence of any obviously oversold or overbought stance, a bet on AAPL ahead of earnings is simply a dangerous game of roulette.

Friday, July 18, 2008

Canaries

Click chart to enlarge
The chart above is a chart of MTL. We were in and out of it when it was trading within its channel, but sold it when it broke through the bottom of its channel and simultaneously took out its 100dma. Now that its 100dma is starting to slope down, we have a stock that is trading below its downtrending moving average... the very definition of a downtrend. This stock will continue going lower until it hits $0, or unexpected industry-specific news turns it around.
It doesn't look good for MTL. This doesn't mean it won't have relief rallies along the way. It just means that it is now in a downtrend, and there is no reason to think it will perform any better than CROX or BCSI for the forseeable future.
This brings us to a more important issue... fertilizer. There are many signs of weakness in the commodities market. MTL is a steel company, and we see weakness there. OIL is a commodity and there is an obvious recent downturn there (break of trend channel, break of moving average). It has always bothered us that the fertilizer stocks trade like commodities. We much prefer the days of buying and selling DELL, AOL, AMZN and GOOG, where at least the number of variables affecting the stock's price was manageable. With these fertilizer stocks, we feel somewhat at the mercy of an uncontrollable commodities market.
So how is this post about canaries? Back in the day (before carbon monoxide detectors), miners would bring canaries in cages into the coalmines. The small birds were sensitive to even trace amounts of deadly gases, and would quickly die if exposed to them. If the birds died, the miners knew that they themselves should exit the mine. We use this analogy to describe stocks because there are strong stocks (the miners), and weak stocks (the canaries), in the same sector. When you start to see the weaker stocks break down, you know it's time to sell the stronger stocks because it won't be long before they succomb to the weakness.
Right now, with commodities breaking down, we are being given early warning about the fertilizer names. This is why you want to stick with best of breed, and always buy low. Investors in MON (a weak fertilizer stock), are more vulnerable than investors in POT (a strong fertilizer stock). MON is breaking down more and more each day. It has already broken the bottom of its channel and its moving average. It is our canary in the coalmine.
So does this mean the fertilizer trade is dead? It may be on the brink of complete failure, but we're sticking with it. Here's why...
First, not all of the fertilizer stocks have broken down. POT, CF and AGU remain strong. MOS is weak, but is staying within its channel nonetheless.
Second, the fertilizer stocks report earnings next week. This is a big shot in the arm for them. It's what pulled them out of their slump in early April.
Third, this market is rotational. The money has moved out of commodities and into financials and homebuilders for now, but that will come full circle at some point. Citigroup has rallied from $14 to $20 over the past 3 days. Would you buy it here? At some point, the rotation will draw money from the financial names and it will be looking for somewhere to go. When money needs somewhere to go, it usually finds it way into the familiar rather than uncharted waters. This psychology is what creates overall trends in the first place.
Fourth, the valuations of these stocks are very reasonable. We understand why an Amazon or a Yahoo at a p/e of 120 finally reaches a point where its valuation outstrips its earnings potential. But in fertilizer, we have p/e's of 10 to 20, well within standard range for the S&P500.
Fifth, it is often a confluence of events that triggers a large move in a stock's price, with a single event acting as the sole catalyst to spark the move. With the fertilizers, we have extremely popular, strong stocks with stellar earnings that have just corrected significantly. All they need is a catalyst. Next week's earnings are the perfect excuse from which to launch a very profitable rally. This is in keeping with our theory that beaten up stocks respond positively to earnings reports and overvalued stocks respond negatively to them, almost regardless of the contents of the reports themselves. We said we would have an opinion on how these stocks would react to earnings as they get closer to their release dates. We are definitely leaning toward a positive reaction to earnings considering how much they've dropped ahead of them. We still have a few days before earnings, but it looks like they'll remain under pressure until they are released.
So what are we doing now? We are a decisive group of traders, for better or worse. We've made the decision to stick with the fertilizer trade (despite some canaries dropping dead), until earnings are released next week. We will have a better idea about their future once we see their reaction to these reports. In the spirit of sticking with our trade, we are actually buying more into this drop. We added some MOS today at 127, bringing our total stake in fertilizers to 64% of our portfolio. The rest is currently either in cash, DDM, and SMN.
We do not recommend people follow us blindly into this trade. It is a high-risk proposition and we are particularly skilled at damage control should things go wrong. Do your own homework, and make your own investment decisions.

Thursday, July 17, 2008

CF and SIRI

Click chart to enlarge
Above is a chart of CF. Considering the sudden drop in commodities, the fertilizer stocks are holding up pretty well. Every drop is met with buying. Now is a good time to beef up your SMN position in case we crash, but we would not sell fertilizer here. Next week the fertilizer companies report their earnings. Our general theory about earnings is that a stock's reaction to its earnings report depends more on where the stock is trading ahead of the report than on the information contained in the report itself. This explains why stocks sometimes crash after stellar earnings reports and rally on seemingly poor reports. If a stock is overbought going into earnings, it is likely to drop regardless of what they report. If a stock is oversold going into earnings, it is likely to rally regardless of what they report. The fact that the fertilizer stocks are putting in a somewhat disappointing performance ahead of their earnings means that they have room to rally when their earnings are released next Thursday.
The fertilizer trade right now is one of patience. It's a wait-n-see game. There is no clear sign to exit the trade yet, and any attempt to do so may make you miss out on a formidable post-earnings rally. That said, you better be hedged with SMN.
Ok, so now you understand our take on fertilizer, so on to something we don't understand...
Why does the SIRI merger require minority broadcasting? What do "minority channels" (whatever that is) have to do with whether or not SIRI-XM would be a monopoly? Our guess is that somewhere in the halls of the FCC is a white guy, as big a racist as Al Sharpton, making rash assumptions about what minorities listen to. To us, this is a blatant and outrageous act of racism. If he were a radio DJ, he'd be out of a job for even hinting that minorities need their own programming. Does anyone care to share a better answer?

Monday, July 14, 2008

Fertilizer rally


Click chart to enlarge
Above is a chart of CF. Far sooner than we thought, it is approaching the top of its channel once again. The ideal scenario would be if these fertilizer stocks reached the tops of their channels before earnings are released next week. We could then sell them and avoid potential disaster. If you're a frequent reader, then you already know our take on the effects of earnings... it depends more on where the stock is trading ahead of them than it does on what they report.
The logic behind selling ahead of earnings is as follows: It is easier to overcome a missed opportunity than lost capital. This is one of the cardinal rules of trading/investing.
Below the chart of CF is a pie chart courtesy of TDameritrade showing the current positions in one of our accounts. Cramer, are we diversified? We would love for someone to call into his show and ask that question:)
Ok, so if the fertilizer stocks get overextended ahead of earnings and we sell, what do we do next? It all depends on what happens next. Although we're getting ahead of ourselves talking about the next trade while still in the current one, we like to have a theoretical game plan so that we're prepared to act should opportunites arise. If the fertilizer stocks sell off enough after reporting, we will simply buy them back. If not, we are looking at loading up on DDM (Ultralong Dow) if the market capitulates. We believe we are very near a short term bottom in the Dow, but it may require a capitulation day to seal the deal. This could easily be provided this week after the financial companies report. We would like to see C drop to 11, and the Dow drop to its 2006 lows of 10700. At that point, we would be willing to enter into a substantial long position in DDM.
We cannot answer all of the emails we receive. Many of you know, we do not even respond to all comments on this board. It's just a matter of how little free time there is in a day. One email, though, hits at an important point, and we would like to share our answer with everyone...
"Snot, I am an avid reader of your blog and I have been watching your trading strategy and learning from it every day. I have heard many times that no one can time the market. Yet you seem to do it pretty well, and you make it look easy using your channels and averages. I believe that you really do have the results you claim because you mention your trades when they are happening instead of after the fact. Your approach to trading yields from my estimate about 50% a year. How is that possible that you can do that when all of the professionals can't? Especially in this crappy market! What am I missing? It seems too good to be true. I am happy I have found your blog because your basic principles have helped my trading a lot. I hope you continue to post every day because I'm sure many people enjoy and benefit from your market commentary as much as I do. Thanks! Greg, WA"
Greg,
First, thanks for the kind words, and we're very glad that you and many others enjoy our blog. We do this largely for fun, but if we help people to understand a different approach to trading, then all the better. The answer to your question is very simple. In fact, it's answered in that little pie chart above. The professionals surely could beat us at this game. But their hands are tied. Faced with billions of dollars to invest, professional fund managers are forced to choose their 40 or 50 favorite stocks. Fortunately, the small investor does not have to. The pie chart above shows that by buying just 4 or 5 stocks, you can leave the pros in the dust.
As far as being able to pull this off in a "crappy" market, it really doesn't matter what the market is doing. As Cramer says, there's always a bull market somewhere. It's very true. Opportunity is not found in the direction of the market, but in the volatility. Up or down is irrelevant.
Best of luck with your trades, and please do not blame us when we someday get it wrong! The best any trader can do is put the odds in their favor over the long term. But short term, errors are inevitable, which is why we have developed a plan for damage control! -Snot, NY

Citigroup

Click chart to enlarge
Although we do not short individual stocks, we have a list of stocks that we believe are headed lower. On this list for some time have been C, BCSI and CROX. Above is a chart of C (Citigroup), which we believe is headed for $11 or lower in the near future.
Our general theory is that investors should buy stocks when they are in uptrends, defined by charts trading above an uptrending moving average, and simultaneously short stocks in downtrends, charts trading below their downtrending moving average. A portfolio of 4 to 5 uptrending stocks held long, and 4 to 5 downtrending stocks held short would put the odds heavily in the favor of the investor regardless of the broad market's direction.
Despite the recent selloff in the market (particularly in financials), you'll see in our previous post that we are not convinced a bottom has been put in just yet. In this spirit, there are charts that still look very bearish. C fits the bill to a tee. MER, C, and JPM report earnings this week, which of course is a major catalyst for movement. We are not betting on C's earnings when we say it's a good candidate for a short. We would prefer their earnings not be on the agenda. We are basing our call to short C purely on its chart. A stock that repeatedly hits the same new high or low eventually breaks through it. In the case of C, a break of short term support at 15.75 could easily lead to a drop of about 30%, earnings aside.

Sunday, July 13, 2008

Broad market

Click chart to enlarge
There are several legitimate reasons to call a market bottom here. Let's review the many very significant milestones of last week.
1.) OIL spiked (it could still go further, to 90. see chart above)
2.) FRE and FNM failed. (Though saved by government intervention, still MAJOR failures)
3.) The Dow broke 11,000 intraday
4.) The Nasdaq and the S&P corrected 20%
5.) VIX (the fear index) nears 30
By all means, one could not be laughed at for calling a bottom right here. All the stars are aligned, and we even have the element of fear. We could easily see a bottom forming here, and a formidable rally to the Dow's 200dma (currently at 12765) already underway.
First, let us preface our next comment by saying that we do not attempt to outright "time" the market, and only guess at its next move for fun. We are long fertilizer and that will not change regardless of the broader market's action. This is the first time since the start of this recent downturn which began in mid May that we feel a bottom could be in place. We would not feel shortchanged if the market rallied from here. While we feel the market is only days from a bottom, we still feel it may be several hundred points away. So, on to our fun prediction, for what it's worth...
Despite all of the signs that a bottom is in place, including the technical fact that the Dow is as far below its 200dma as it was at January's bottom, we predict a retest of Friday's low at a minimum, and more downside as a likelyhood.
Here's why... while the government provided a safety net for FRE and FNM, they explicitly said that they would not provide a safety net for any other financial institutions. (Unless they're lying again). It is not far fetched to predict the collapse of one or more substantial financial institutions in the days ahead. With earnings season starting in force this week, all it would take is for one bank to report lower than expected earnings, sparking rumors of failure which would lead to a run on the institution. A run on a bank is simply a mass rush by its customers to withdraw funds fearing the worst. The rumored failure quickly becomes self-fulfilling. This happened to IndyMac Bank on Friday. The government shut it down in order to stop the panic and allow people to regain their confidence in the company over the weekend.
When we predicted a bankruptcy, we were thinking along the lines of an airline, not Fannie and Freddie. The speed and depth of our economy's deterioration is shocking. In light of Friday's events, it would come as no suprise if LEH collapses this week. C, MER and JPM report this week.

Wednesday, July 9, 2008

Ag rally

Click chart to enlarge
Seems too much too soon to us, but the Ag stocks are in rally mode, so we aren't complaining. We "only" got 60% of our capital in this time around, and we rarely if ever chase stocks as they rally, so 60% it is. If these stocks continue to rally strongly over a very short period of time, we may take a little off the table. Perhaps back to a 50% exposure. While the support of the broader market is not required for Ag to run up, we are troubled by OIL's drop to the bottom of its channel. The slightest news story and OIL could tack on a quick 10%, which could take the Dow down below 11000.
The chart above is a chart of CF. It stopped falling at the bottom of its trend channel and its 100dma yesterday. We added more CF yesterday at 136. We should have backed up the truck, but only hindsight has 20/20. The Ag stocks report earnings in two weeks. Where they go after reporting has 90% to do with where they are trading prior to reporting, and 10% to do with the contents of the reports themselves. If they rally to the tops of their channels (unlikely), they will surely get slammed after reporting, regardless of how well they do. If they drop back down ahead of earnings, we expect a substantial rally after they report, as long as earnings are not terrible. We will determine the best exposure before the reports based on their locations in their respective channels. Holding a stock through an earnings report is generally not a good idea, but each scenario is unique.
In other news, although we do not short individual stocks, our short picks (BCSI, CROX and C) are all doing as expected. They are heading for $0 until an equal and opposite force turns them around.

Tuesday, July 8, 2008

Ag breakdown?


Click charts to enlarge

The chart at the top is all-important OIL. It just fell back to the middle of its channel to 84.91, after hitting a low of 83.60. Meanwhile, the Dow didn't rally. It's not a good scenario. Now OIL has room to run to the top of its channel, currently at 89, sending the Dow on another leg down. We're predicting a sharp jump in OIL to the top of its channel triggering a capitulative washout move in the Dow, allowing at least a short term bottom to be put in. But when?

Meanwhile, the chart of MOS (bottom chart) is getting too "comfortable" hanging out near its support. Charts usually bounce off of support levels quickly. When they hover over them for extended periods of time, it's often (but not always) a warning sign. If MOS does break down, it will not be a slow, multi-day event. It will be a sharp drop, gaining momentum as more and more traders realize that support has been decisively broken. It does not mean that Ag is dead. As long as the majority of the stocks in a sector remain in their channels, we can have a new move to the upside. CF is nearing the bottom, but POT and AGU are far from a breakdown. If a break of the channel happens, we're going to treat it as a buying opportunity, loading up primarily on shares of AGU. We would normally be more heavily invested at this stage of the game, but the action of the broader market makes us cautious. We're only 51% invested, and hedged with a healthy dose of SMN to boot.

Channel trading unfortunately is sometimes not as simple as it appears. Every time stocks approach the bottoms of their channels, you have to prepare for the worst, and try to get in with the least possible damage. Even when our timing is excellent, our portfolio spends some time under water before making new highs. Let's just hope we get that OIL spike soon to stop this slow bleed, which is never a comfortable market to be long in.

Thursday, July 3, 2008

Mosaic - MOS

Click chart to enlarge
Above is an updated chart of MOS showing its reaction to support at the bottom of its channel and its 100dma. So far, this is all business as usual. If the Ag names go much lower, their p/e's will slip below 10, at which point we'll have to advertise ourselves as being value investors, a title which we would rather avoid. "Growth investor" just has a nicer ring to it. Whether or not the support holds is up to the broader market, which is up to OIL, which is up to the Bush/Cheney administration. We have yet to receive our check from Dick Cheney's Halliburton stock option profits that would allow us to offset our exorbitant fuel bills. Our readers will be the first to know when it arrives.

Wednesday, July 2, 2008

Where's the bottom?


Click charts to enlarge
The chart at the top is CF. All of the Ag charts are similar right now, so there's no need to post more than one of them. The chart below CF is a chart of OIL, and the chart at the bottom is a chart of DRYS (more on that later). We've long been predicting an end to the bleeding once OIL tops out, even if just briefly. One more spike in OIL, to 88, and we could get a capitulation day that puts an end to the current selloff (at least for a while).
The selloff today was focused on commodities across the board. Commodities have been the market's leaders lately. When the leaders finally give in to the selling pressure, it indicates that an end is near because fear is taking hold. Think of SMN as the VIX of the commodity sector. Today, it spiked. Look at charts of WLT, MEE, MTL, SID, and the Ag names to see where the damage took place today. Another day or two of this and SMN will be at 40. Warren Buffett says that you should be fearful when others are greedy and greedy when others are fearful. On this advice, SMN at 40 would indicate that it's time to be greedy.
We sold MTL and SID on a break of their channels and moving averages today. We did this mostly to raise more capital to buy additional shares of the Ag names as they drop. We lost a point on SID and 3 points on MTL, but these were small positions that we were not committed to which were more than offset by our hedge, SMN. We bought some MOS, POT, CF and AGU today, bringing our total portfolio to 45% Ag, 55% cash and SMN.
The question arises "What if the Ag names break the bottoms of their channels and plunge?" It's a very valid concern, and there is no guarantee that it won't happen. If we traded just one cycle, we would either make or lose 20%. We could not tell you which. If we traded 10 cycles, we would make 150%. The best we can do is put the odds in our favor over time. By focusing the majority of our buying in the leading stocks when they reach the bottoms of their channels, we profit over time. We do not profit every time.
When we do get into a trade that goes the wrong way, we approach it in the following way:
First, most of our buying is done at the bottom of the channel to start with. We have cash waiting just in case the stocks we own break support and drop hard. Case in point; we're only 45% invested and the stocks we're buying are near the bottoms of their channels. We also have some cash in hedges that can be sold (at a profit) to be invested in stocks that have broken their supports. At some point after breaking a support line, a plunging stock will bounce strongly. This bounce is the opportunity for you to do damage control on these positions. If you continue to buy into the plunge, at some point, your entire position can be sold at a break even price, or a small loss or gain. If we make an error large enough to put us in "damage control" mode, we quickly admit that we made an error, plan our escape, get out at an opportune moment, and await the next trade.
Look at the bottom chart of the three above. It's a chart of DRYS from back when the drybulk sector's run finally came to an end. In early November 07, it broke its moving average and its trendline. As scary as it is to hold a stock while it breaks support and plunges, look at what happened later that month. The stock was actually trading higher than where it was when it broke down. The best thing to do in a situation like that is to bail when you have the chance to break even. Stocks don't go straight down. Whether the broader trend is up or down, they are always fluxuating. Our current Ag trade may well turn into "damage control", but considering no one knows where the market will go next, we have to work our way back into the Ag names as they approach the bottoms of their channels because this discipline works over time.
Speaking of working our way back into the Ag names, it is times like this that you get the opportunity to see which stocks the pros aren't selling. Of the Ag names, AGU has been putting in the most resilient performance. The best stocks are always the hardest to buy because they never give you the opportunity. It will take a while longer to play out, but our guess is that AGU may be the best percentage gainer after this correction if the Ag names go for another run to new highs.
Intentional non sequitur: Does anyone find it odd how absent the government has been in the market's latest plunge considering how active they were earlier in the year? Isn't it time for some kind of intervention? Perhaps they've given in to just letting the market find its own bottom?