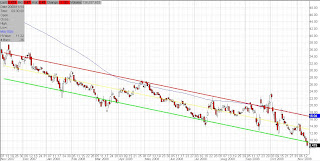
Click chart to enlarge
The chart above is a chart of DDM extended out to year's end. After the big drop in early October, the market was extremely oversold. In its attempt to catch up with the moving average, it could have done one of three things, ranging from most bullish to least bullish...
1.) Uptrending channel - We had originally hoped for this after selloffs in mid October put in successively higher lows. But all bets were off by the third week of October when the market broke those higher lows.
2.) Sideways channel - Once all bets were off for an uptrending channel, we hoped for a sideways channel instead. This is not out of the cards yet. A rally to DDM 40 puts this back in play. Unfortunately, recent market weakness points to a strong possibility that we're in the least desirable pattern, the descending triangle.
3.) Descending triangle - Particularly brutal to longs, as each rally is weaker than the last. Descending triangles almost never end well. A break of support is more likely than a break of resistance.
.....
Of course there is no way of knowing how many more iterations within the triangle there will be, if any. If there is another rally before support is broken, will we reach DDM 40, keeping the sideways channel in play, or will we put in another lower high, perhaps DDM 36?
We don't have these answers, but as time goes by, the pattern will become more obvious. The value in keeping track of such patterns is that if they play out the way you expect, then the next move is that much more predictable. If we do rally to DDM 36 and then come back to support, we will have a very clear triangle which will be obvious to all technical traders, if it isn't already. In that case, a break of support or resistance will be a major event. Arguably a break of support would already be a significant event, as no pattern recognition is required to know that the market has been flirting with a support level for almost 2 months.
.....
One thing to be careful of, which can occur at any time, is an intraday break of support. Hedge funds like to take the market below support to to take out the stops. Then they'll bid it back up later in the day. As long as the market doesn't close below support, they've met their objective and the pattern is still intact. This can be tricky because as it's happening, it seems that support has been broken and there is no bottom in sight. This is why we don't consider support to be broken unless we close decisively below it. At that point, the market is free to spiral out of control the following day.
.....
The way to play it: Buy at DDM 28 with the intention of selling at DDM 35. Set a mental stop loss at DDM 26. This results in 2 points of downside and 7 points of upside. Rinse and repeat. A lot easier said than done.


